
Meme Fear
& Greed Index
A first of its kind meme index.
Built by the industry leading CFGI.io
Why us?The full meme market Fear & Greed Index
How we create the most accurate Fear & Greed


Compare our Fear & Greed Index
We're so confident that our Fear & Greed is better than the others, we've compared against the most popular one for you.
DOGE
2025-08-13 10:03:45 / 2025-08-19 22:03:58Advanced Public Data Algorithms
The reason we can offer such an accurate Fear & Greed Index across multiple timeframes and currencies is because the quality of our data is echelons higher than any other company. We have 10 AI powered algorithms that run 24/7 to make sure you get the most accurate indicator possible. We're so confident in our data, we show and explain it for free to everyone on our currency pages, let developers build with it and even build our own AI trading system on top of it.
Compare MFGI
We're so confident that our Fear & Greed is better than the others, we've compared against the most popular one for you.
Advanced Public Data Algorithms
The reason we can offer such an accurate Fear & Greed Index across multiple timeframes and currencies is because the quality of our data is echelons higher than any other company. We have 10 AI powered algorithms that run 24/7 to make sure you get the most accurate indicator possible. We're so confident in our data, we show and explain it for free to everyone on our currency pages, let developers build with it and even build our own AI trading system on top of it.
Technical Charting is displayed using TradingView's technology, a platform which offers tools and data for comprehensive market research: here, you can track the latest events in the Economic calendar, watch live prices, and much more.
Fear and Greed Indicator explained
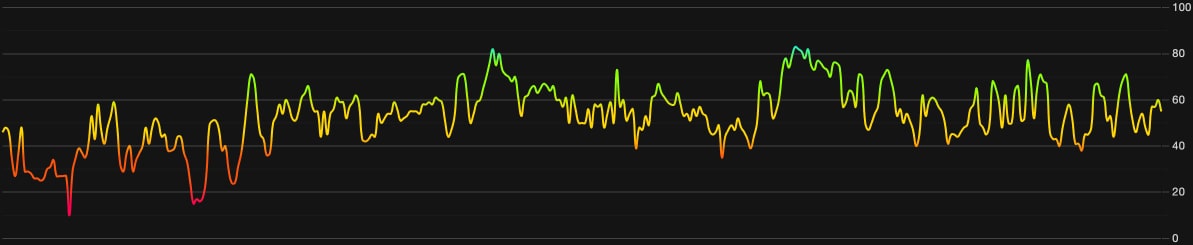
Main Indicator
- Main Indicator
- Price Score
- Volatility
- Volume
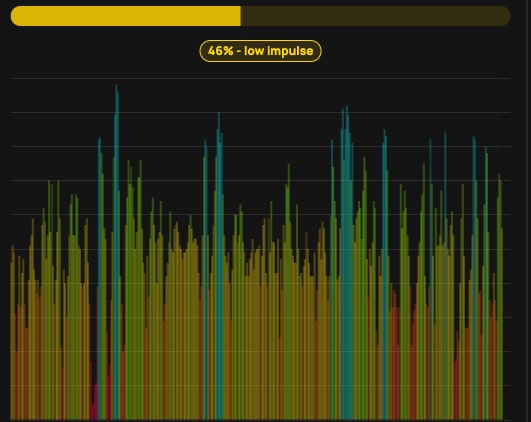
- Impulse
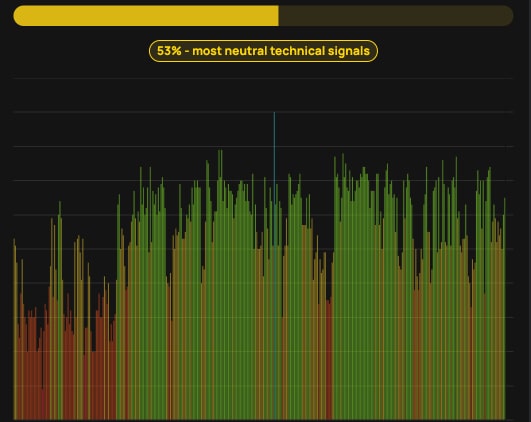
- Technical
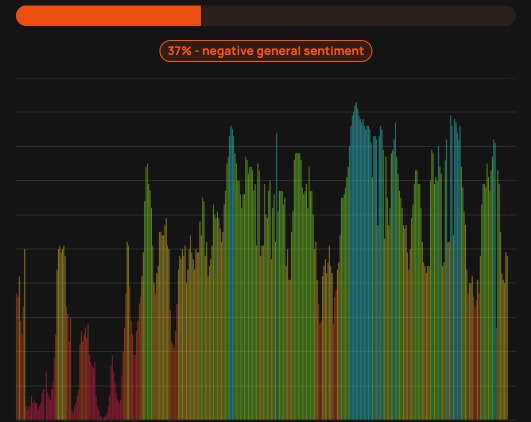
- Social Media
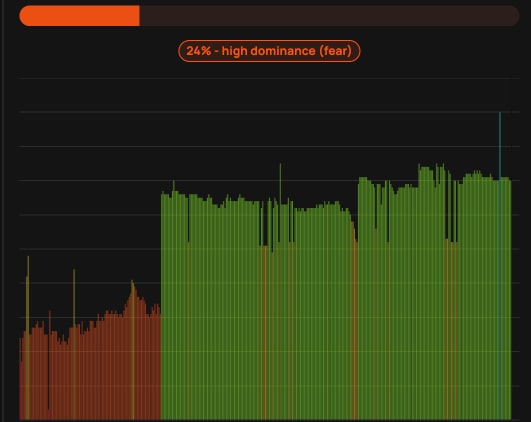
- Dominance
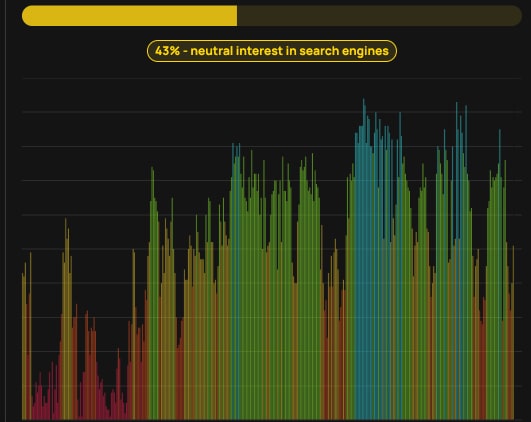
- Search
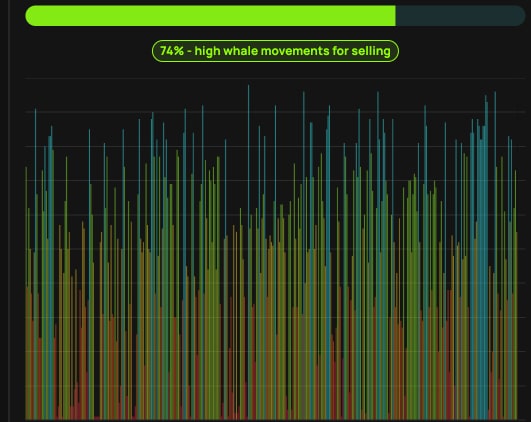
- Whales
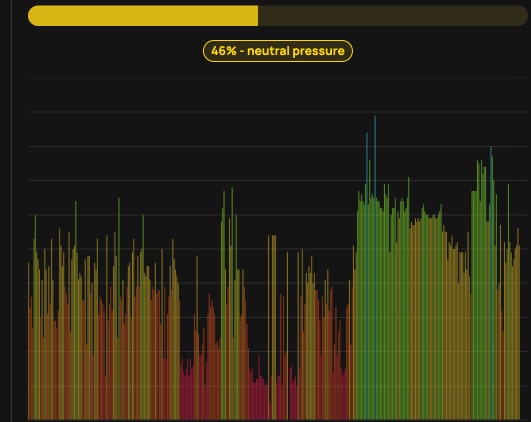
- Order Book
Fear and Greed Index is a multifactorial indicator for meme sentiment analysis, which considers the most critical parameters that determine the psychology of the market to give a result that defines the level of fear or greed in the market.
Fear and greed index values range from 0% (extreme fear) to 100% (extreme greed). The values are:
0 - 19: EXTREME FEAR
20 - 39: FEAR
40 - 59: NEUTRAL
60 - 79: GREED
80 - 100: EXTREME GREED
The Price Score indicator is a relevant indicator to analyze and assign the price evolution a certain numerical value.
This module studies the price trend in order to determine in a range from -1 to 1 if the market has a bearish or bullish trend.
The main trend defines one part of the general sentiment of the market, and is a factor of weight when analyzing a chart. A pronounced and long-lasting positive trend generates a greater feeling of greed. In the same way, when the trend is negative, a greater feeling of fear is generated, regardless of other factors.
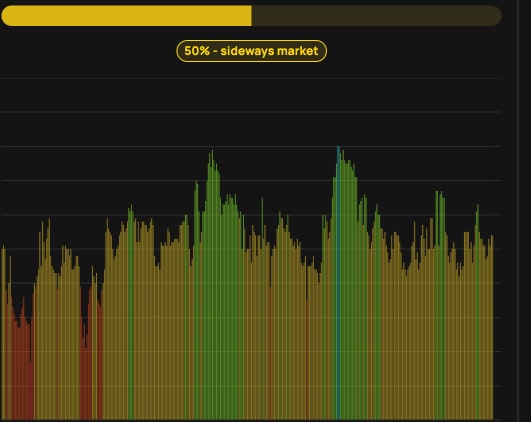
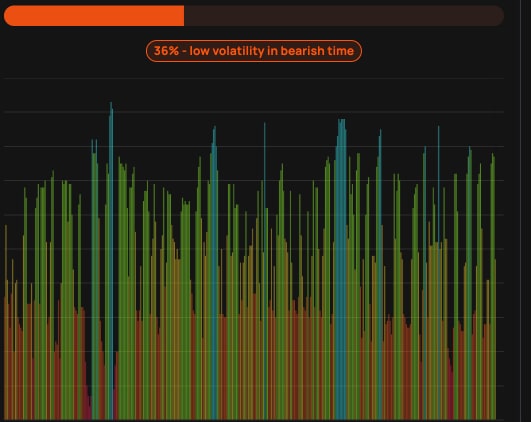
Price Volatility is also another important indicator and the biggest trigger for market sentiment. To measure it, we use values between 0 and 1 that determine the degree of current price fluctuation for the desired time frame.
Higher volatility implies a riskier market, which further polarizes bullish and bearish sentiments. An increase in volatility implies greater greed in a bull market, but also greater fear in a bear market.
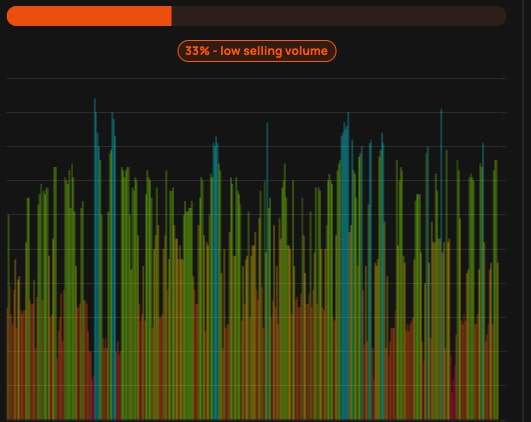
Like volatility, the Volume is a determining factor.
An increase in the volume implies a greater negotiation in the market, which is caused by an increase in the movements caused by an interest, which is synonymous with great sentiment. A strong volume determines a strong level of greed in bull markets, but also a strong level of panic in bear markets.
Like volatility, it is also calculated with a range between 0 and 1.
The Impulse indicator measures the current price strength compared to previous values to determine in a range from -1 to 1 how it is affecting the market sentiment.
Impulse has a huge impact on sentiment, as on a psychological level we tend to place more importance on the latest price move.
The strength of this shows price inclination that can be more or less pronounced and determines the polarity. A strong bullish impulse in a market implies a greater feeling of greed, in the same way that a strong bearish impulse generates a greater feeling of fear or panic.
It is proven that technical analyzes themselves influence market sentiment, especially those that are more popular.
The technical analysis indicator analyzes for the 26 most popular stock market indicators and subdivides them into 2 main categories that differentiate them in their type of trend indicator or oscillator. Subsequently, each one of them is averaged and assigned a certain weight based on the popularity of each one. These results fairly accurately reflect the impact generated by these charts on market analysts.
Social media sentiment analysis is one of the main factors determining meme market sentiment.
This is done through an algorithm that analyzes the popularity of each meme at a given time, based on the voting system of one of the largest platforms in the meme world, to establish a social sentiment index.
This other indicator takes into account the dominance of with respect to the general market. When it gets greedy, altcoin investments greatly increase and the total market capitalization increases, which also decreases dominance. The same thing happens when the market panics but in reverse. For this reason, both the token capitalization and the total market capitalization are calculated.
But there is also a correlation between the dominance of and the dominance of the main altcoins, so the indicator calculates different values for each meme.
Trends is another factor that determines the sentiment of a particular market. We analyze the search volume on major search engines like Google.
The lookup indicator looks at the current value and compares it to previous values to determine what particular interest there is. For this, specific search terms are used that determine the purchasing or ceding interest of the token, thus excluding general terms that only define popularity without demonstrating negativity or possibility.
One of the analyzes that can determine the meme market is the movement of whales.
MFGI analyzes the movements of superlative amounts made by large investors in two ways, first it analyzes large movements from wallets to exchanges of tokens and compares them with the large movements of stable coins that are also made from wallets to exchanges to estimate the proportion of purchase and sale to be made.
A high ratio of token movements to stablecoins indicates a strong selling intent which means a greed market, while a higher ratio of stablecoins movements indicates a stronger buying intent and fear market.
Another great predictor of sentiment through a quantitative source are the order books. meme Fear and Greed Index analyzes the order book for the token on a popular exchange to determine the buying and selling pressure that contiguous orders exert on the price. In such a way that you can know the buying and selling pressure that the orders which are going to be executed will exert.
Stronger buying pressure than selling pressure close to price is a clear indication of bearish sentiment, as there are more buy orders within equal distance to the price. While stronger selling pressure above price indicates a bullish sentiment, because there are more sells to execute than buys at the same distance.
FAQ
The meme Fear and Greed Index (MFGI) is a comprehensive tool for analyzing meme sentiment. It takes into account critical market indicators to determine the level of fear or greed present, with a range of 0% to 100%. The five possible classes within this range are Extreme Greed, Greed, Neutral, Fear, and Extreme Fear.
The MFGI uses various modules to analyze influential variables in the meme market, including volume, volatility, dominance, whale movements, search engine data, and order book analysis. It also features an algorithm that evaluates the social sentiment and how popular technical analysis are affecting the market. Each module is given a specific weight based on its statistical impact on the market.
With the MFGI, investors can accurately understand the emotional psychology of each meme and use a single indicator to make investment decisions based on a comprehensive analysis of all relevant factors.
The indicator operates on a simple principle: values above 50 indicate a positive market sentiment ranging from Neutral to Extreme Greed. On the other hand, values below 50 imply a negative market sentiment ranging from Neutral to Extreme Fear. The stronger the sentiment, the greater its potential impact on the current price.
Investing in the meme market using MFGI involves some effective strategies to consider. For a long-term investment approach, it's advisable to look for extreme feelings to buy and sell. Extreme Fear signals a good opportunity to enter the market, while Extreme Greed times present an excellent opportunity to exit.
For day trading or scalping, following a shorter timeframe and focusing on a strong recent feeling of greed is possible. However, it's essential to follow the previous strategy while ensuring proper risk control.
The beta version of MFGI includes the top 40 strongest memes on the market, reducing the risk of investing in tokens that are too speculative or prone to fraud. If we receive positive feedback, more tokens will be added to the product.
For those investing in memes, our aim is to find buying and selling opportunities that maximize profits while minimizing risks. One way to do this is to focus on markets with low long-term risks. The meme market has demonstrated a positive trend over time and is expected to continue for years to come, making it an enticing choice.
The MFGI takes into account human psychology and can help identify patterns of irrational behavior that repeat throughout market cycles. Since market movements are heavily influenced by these emotional impulses, measuring and quantifying them can provide insight into the market's psychology and lead to profitable investment decisions.